Back in 2011, as part of a convoluted New Year's resolution, I started tracking my personal travel daily. Each day, I record how many miles I travel, by what mode, and whether I am traveling for transportation or exercise/pleasure. Why did I start collecting these data? Because I figured that there was the chance that some day it would be useful.
And that day is … today!
I realized recently that I had a pretty good comparative data set between the April to July portion of 2012 and 2013. Not too much in my life changed in that time frame. Most days I woke up, went to work, came home and went for a run. Probably the biggest difference, transportation-wise, was that in 2012 there were no Hubway stations in Cambridge, and in 2013 there were. In addition, since Hubway keeps track of every trip, I can pretty easily see how many trips I take, and how many days I use each mode.
To the spreadsheets!
The question I want to test is, essentially, does the presence of bike sharing cause me to walk and bike more frequently, less frequently or about the same? Also, do I travel more miles, fewer or about the same? A few notes on the data. First, I am using April 6 (my first Hubway ride in 2012) to July 9 (in 2012 I had a bike accident on the 10th and my travel habits changed; Hubway launched in Cambridge at the end of the month, anyway). Second, I collect these data in 0.5 mile increments, and I don't log each and every trip (maybe next year) but it's a pretty good snapshot.
The results? With Hubway available, I ride somewhat more mileage, but bicycle significantly more often. In addition, my transit use has declined (but I generally use transit at peak times, so it takes strain off the system) and I walk about the same amount.
Here are the data in a bit more detail for the 95 days between April 6 and July 9, inclusive:
Foot travel. In 2012 I walked 84 days in the period a total of 190.5 miles. In 2013, the numbers 83/180. (Note that I do not tally very short distances in these data.)
Bicycle travel. In 2012, I biked 66 and, believe it or not, in 2013 I actually biked fewer days, only 64. As for the distance traveled, I biked 466.5 miles in 2012, and 544.5 miles in 2013. So despite riding slightly fewer, I biked nearly 20% more distance. This can be partially explained by my participation in 30 Days of Biking in 2012, when I took many short trips in April.
In addition, in 2013 I began keeping track of my non bike-share cycling trips. I only rode my own bike 14 days during the period, tallying 44 trips on those days. But there were many days where I rode my own bike and a Hubway; I took 29 Hubway trips on days I rode my own bike; on 8 of the days I rode my own bike, I rode a Hubway as well.
Bike share trips. In 2012 I rode Hubway on 39 days, totaling 71 rides, an average of 1.8 Hubway rides per day riding Hubway. In 2013, I rode Hubway on 58 days, but tallied 185 rides, an average of 3.2! So having Hubway nearby means that I ride it more days, and more often on the days I ride.
Transit. In 2012, I took transit almost as frequently as bicycling, 61 days. I frequently rode the Red Line to Charles Circle and rode Hubway from there to my office. In 2013, my transit use dropped by nearly half, to just 31 days, as I could make the commute by Hubway the whole way without having to worry about evening showers or carrying a lock.
We might look for the mode shift here. My walking mode shift has not changed dramatically. My bicycling mode shift hasn't appreciably increased, although the number of total rides likely has. My transit mode shift has decreased, as I shift shorter transit rides to Hubway.
Now, if they ever put a station near my house, I'll get to see how those data would stack up. My hypothesis: I'd never walk anywhere, ever.
Thursday, July 25, 2013
Tuesday, July 16, 2013
Longfellow bus-bike illogic
The Longfellow project is set to begin next week—signs have been flashing across the city advertising the multi-year lane closure—and at a meeting last week (documentation here), concerns were aired about traffic, gridlock, and banning bicycles from the roadway when the T is closed and buses traverse the bridge.
Wait, when the T is closed and transit riders are shunted on to a bus shuttle, were going to prohibit cyclists from crossing the bridge? When there are Hubway stations on either end? When buses will be packed with weekend travelers and trip lengths will be 10 or 20 minutes longer than usual? When taking a few people out of the system would reduce crowding and speed up trips for everyone else?
Yup.
MassDOT and the MBTA had been cagey about this, never outright saying that bikes were verboten until very recently, when their language was challenged (what does "emergency bike/bus lane" mean, anyway?) by cycling advocates.
In a recent email to stakeholders, MassHighway administrator Frank DePaola wrote:
While this is dismaying to the cycling community, it seems to be almost insulting to MBTA drivers. It almost says to them that the T and MassDOT don't have faith in them to successfully pass cyclists—something they do thousands of times per day in heavy traffic—on an otherwise closed roadway. I'm sure that experienced MBTA bus drivers can drive across the Longfellow and pass cyclists at the same time.
A salient issue is the pinch point at the Boston end of the bridge, where the width reduces from 29 feet to 22 feet for a 300 foot stretch. This is of concern, but could be remedied with a simple instruction to bus drivers: do not pass cyclists on this section of bridge. There is no need to erect signage to get this point across; MBTA supervisors could remind drivers of the policy before each shift crossing the bridge. (The narrowness of this portion of the bridge is another reminder that two-way vehicle traffic at any other time should be a total non-starter, especially since bicycle counts have actually increased since the new bridge configuration.)
Yes, this will result in some measurable delay for bus passengers. But these delays, I think, would be minimal. Let's run some (estimated) numbers:
A better policy than hoisting "no bikes" signs would be to allow bikes, and evaluate any issues which arise. This is the policy they are taking towards Mass General, TD Bank and other institutions which are insisting than closing the road to traffic will result in so much gridlock the people won't be able to get home from sporting events or concerts (seriously) or home from the hospital (a major reason the inbound direction was selected to be kept open was to allow emergency access to MGH). If we are going to make concessions to these groups, we should do the same for cyclists who will actually help to alleviate congestion during the closure times.
Wait, when the T is closed and transit riders are shunted on to a bus shuttle, were going to prohibit cyclists from crossing the bridge? When there are Hubway stations on either end? When buses will be packed with weekend travelers and trip lengths will be 10 or 20 minutes longer than usual? When taking a few people out of the system would reduce crowding and speed up trips for everyone else?
Yup.
MassDOT and the MBTA had been cagey about this, never outright saying that bikes were verboten until very recently, when their language was challenged (what does "emergency bike/bus lane" mean, anyway?) by cycling advocates.
In a recent email to stakeholders, MassHighway administrator Frank DePaola wrote:
There have been recently a few tragic incidents between Busses [sic] and bicyclists one common factor has been tight clearances and the bicyclist on the right hand side of the bus. During a red line bus diversion the frequency of busses [sic] between Kendall and Park Street will be quite high the probability of an incident on the tight quarters of the bridge, especially at the approaches is too high and safety is a big concern.Let me attempt to rephrase:
There have been multiple crashes where buses have hit cyclists when passing them. If we get rid of the bikes, we won't have to worry about these any more.Never mind the fact that these bicycle-bus incidents have occurred with buses in normal operation, on roads with other vehicles, many distractions, and with buses pulling in and out of bus stops. The Longfellow, while narrow, won't have any of this. There are no bus stops on the Longfellow. There will be no other cars on the Longfellow at this time. When a bus pulls out of a stop, the driver has to worry about cyclists passing on the right and cars going around on the left, while at the same time worrying about the rider running up and tapping on the door to try to get on the bus. None of this will take place on the Longfellow. Yet the default policy is to ban bikes.
While this is dismaying to the cycling community, it seems to be almost insulting to MBTA drivers. It almost says to them that the T and MassDOT don't have faith in them to successfully pass cyclists—something they do thousands of times per day in heavy traffic—on an otherwise closed roadway. I'm sure that experienced MBTA bus drivers can drive across the Longfellow and pass cyclists at the same time.
A salient issue is the pinch point at the Boston end of the bridge, where the width reduces from 29 feet to 22 feet for a 300 foot stretch. This is of concern, but could be remedied with a simple instruction to bus drivers: do not pass cyclists on this section of bridge. There is no need to erect signage to get this point across; MBTA supervisors could remind drivers of the policy before each shift crossing the bridge. (The narrowness of this portion of the bridge is another reminder that two-way vehicle traffic at any other time should be a total non-starter, especially since bicycle counts have actually increased since the new bridge configuration.)
Yes, this will result in some measurable delay for bus passengers. But these delays, I think, would be minimal. Let's run some (estimated) numbers:
- The MBTA will have up to 15 buses on the Red Line loop to serve passengers. Assuming the route takes 15 minutes (it will likely take slightly longer) this is an average of 1 bus per minute.
- Each bus will carry 50 passengers (35-40 passengers plus standees).
- The 2011 bicycle/pedestrian counts found an average of 30 bikes per hour in each direction crossing the Longfellow midday on weekends. While numbers may have climbed since, some cyclists will choose other routes due to the construction, so this is a fine estimate.
- Cyclists on this section will average 8 mph going towards Cambridge (uphill) and 16 mph towards Boston (downhill).
So let's run some scenarios. A bus traveling at 20 mph will traverse the 300 foot narrow section in approximately 10 seconds. Thus, an inbound bus which would have to slow behind a cyclist going 16 mph would lose 3 seconds. An outbound bus would have more of a time penalty; following a cyclist for 300 feet through this pinch would take 25 seconds to cover 300 feet, a delay of 15 seconds.
But how often would there be any conflict between a bus and a cyclists in this section of roadway anyway? It is not like there will be a constant line of buses or a constant stream of cyclists. Let's assume a buffer for both buses and cyclists regarding any bus/bike road conflict of double the actual time needed to traverse the segment. For buses, it would mean that the would occupy these 300 feet of roadway 33% of the time (20 seconds every minute). For inbound cyclists, they would occupy the roadway 22% of the time (26 seconds every two minutes). Outbound cyclists would occupy the roadway 42% of the time (50 seconds every two minutes).
Let's do some math. For inbound traffic, there would be a potential conflict 7.5% of the time. This would delay 4.5 buses per hour an average of 3 seconds each, for a total of 13.5 seconds per hour. Assuming 50 passengers per bus, this would be a total of 675 seconds of delay per hour. (Although this might be even less as buses would slow to cycling speed or lower to navigate the turns at Charles Circle.)
For outbound traffic, there would be a potential conflict 14% of the time. This would delay 8.4 buses per hour for an average of 15 seconds each, for a total delay of 118 seconds per hour. Again, if we assume 50 passengers per bus, this is a total of 5880 seconds of delay per hour. (This too might be less as buses accelerate up the bridge approach at a slower average speed.)
This is a total of 6555 seconds of delay for bus passengers per hour. However, this is actually a pretty small number. If there are 50 passengers per bus in each direction, and one bus crossing the bridge every minute, there will be 6000 passengers per hour. Thus, the total delay per bus passenger by allowing cyclists on the bridge (and having buses not pass them in the narrow section) will be just 1.1 seconds per passenger. Considering that the total delay due to Red Line closures will amount to 10 to 20 minutes, this will just 1/500th to 1/1000th of the total detour. In other words, any delay caused will be negligible.
We can also attempt to quantify the delays for cyclists who would be rerouted around the bridge. There are many fewer cyclists, but the potential detours result in a much longer delay. Requiring cyclists to use the Harvard or Craigie Bridge will add 2 to 4 minutes to a trip from Park Street to Kendall. With 60 cyclists per hour, this would equate to 180 minutes—or 10,800 seconds—per hour, far higher than the total delay for bus passengers.
In addition, there are two temporary signs which, I think, would be perfectly acceptable to the bicycling community and which will help mitigate potential conflicts further: First, on each side of the bridge, there should be a sign reading
BICYCLES KEEP SINGLE FILEThis will remind cyclists that there are buses passing on the bridge. The second sign, approaching the outbound side in Boston, would read:
BICYCLES YIELD TO BUSESThis would mean that if a bicyclist and a bus approached the choke point at the same time, the bus would go ahead, and the bicyclist would then be able to navigate the narrow section before the next bus enters the bridge. This would reduce potential conflicts, as well as reducing the need for buses to pass cyclists in this narrow section.
A better policy than hoisting "no bikes" signs would be to allow bikes, and evaluate any issues which arise. This is the policy they are taking towards Mass General, TD Bank and other institutions which are insisting than closing the road to traffic will result in so much gridlock the people won't be able to get home from sporting events or concerts (seriously) or home from the hospital (a major reason the inbound direction was selected to be kept open was to allow emergency access to MGH). If we are going to make concessions to these groups, we should do the same for cyclists who will actually help to alleviate congestion during the closure times.
Google Maps has some work to do on route hierarchy
Last week we examined some of the changes—many of which I think are positive—to the Google Maps interface. However, Google Maps has fallen in to an old trap which harms the overall product: they unilaterally classify US Routes as a higher status road type. This leads to maps where some minor roads appear to be highways, while other routes with higher capacities and uses, appear to be smaller roads.
First, a case from west of Boston:

The two red circles on the map above represent the locations of the photos below. Which is which?


It would make sense for the highway on the left would be shown with a higher symbol level than the city street on the right. This, however is not the case. The image on the left (both from Streetview) is of Massachusetts Route 9 in Newton, showing a typical section of this divided highway. The image on the right shows a typical section of US Route 20 in Watertown, a mostly two-lane city street. Note on this map the second-level (lighter orange) roadways. They are few in number, and therefore quite prevalent. Thus, you would think that they are major, not-quite Interstate-level highways. So if you wanted to avoid the Turnpike (I-90) you'd be right in thinking that Route 20 is a viable alternative.
If Google Maps is going to make these changes, they should review the actual functionality of each roadway to properly classify them based on speed and capacity. Simply labeling every US highway as a higher category of roadway is folly.
It's helpful to touch on the history of the US Highway numbering system in discussing the use of US Highways today (there is a good article on Wikipedia). The system was put in to place in the mid-1920s, so it is nearly a century old. Before that point, most roads were named (often as Auto Trails), although many of these names were of routes which were not improved; US Army convoys in 1919 and 1920 averaged only about 30 to 60 miles per day (not per hour; per day). The US Route numbering system was more of a way to codify these names across state lines (as New England had done a few years earlier; which is why many state highways in New England retain their number when crossing state lines) than to build improved highways.
So Route 20 was numbered in 1926, having previously been New England Route 5. Route 9 was originally the Boston-Worcester Turnpike, and was rebuilt in the 1930s when streetcar operations ceased, becoming one of the earliest roads in New England with some grade separation. (It has barely been improved since; it still has steep grades and some traffic lights. Of course, neither has Route 20.)
Thus, Google Maps, in 2013, is basing much of its route hierarchy on a numbering system put in to place nearly a century ago. Not only does this make little sense, but it harms the usability of its mapping interface.
Thursday, July 11, 2013
Google Maps updates
If you're anything like me, you took a look at Google Maps at some point in the past 24 hours. And if you're anything like me, within seconds you realized that Google had made significant symbology changes to the interface. It's enough to catch your eye, but not drastic enough to limit functionality. It took me a second to place many of the changes. And while all of their servers seem to have been updated, I have enough old screenshots saved that I can go back and find older maps and suss out some of the major changes. A quick overview of what I found for other map nerds like me:
Roads:
Gone are yellow roads. Gone. The old map's road hierarchy was:

 Here's the New York office, and Boston. Not far away from the Mountain View HQ is the Bonnie Kitty Fake Company. Here it is on Google Plus. I wonder if this is an easter egg, or if someone forgot to delete a test. Sadly, the number they have listed for it does not go through. Here's a screenshot of the page for Bonnie Kitty, in case it disappears. Notice a familiar color scheme?
 |
| iOS version |
Roads:
Gone are yellow roads. Gone. The old map's road hierarchy was:
- Minor roads: Light gray line (when zoomed out) / white line with gray border (zoomed in)
- Minor arterials: Yellow background with a darker tan border
- Highway ramps: Light orange background, darker orange border
- Highways: Orange background, and even darker borders
The new map hierarchy has changed somewhat significantly as follows:
- Minor roads have generally retained their symbology, although at some zoom levels they are a darker gray to better offset them from minor arterials.
- Minor arterials, however, are now a white background with a gray border. The only difference between the arterials and the smaller roads is in the line width—the more major roads are wider, and do not turn to single gray lines as quickly when zooming out. Yellow roads have been eliminated.
- Major arterials have a new classification of light orange. Roads with this classification include, for example, Storrow Drive and Commonwealth Avenue in Boston. It also seems that all US Highways are included in this category.
- Highway ramps are given a paler orange symbology.
- Limited access highways are given a darker symbology, and have decreased somewhat in scope, inasmuch as roads like Storrow Drive are no longer in this category.
 |
| iOS version(pardon the Spotcycle app points on the old part.) |
What this boils down to is a lot less color, especially in urban areas. While it does mean that major highways better stand out, making US Highways—a somewhat anachronistic designation since the US Highway designation was somewhat outdated in the 1960s as Interstates became the main thoroughfares—automatically a higher level in the hierarchy is a questionable decision. I'm not sure how I like the loss of the yellow roads, but it does allow built areas to slightly slip in to the background and for other features to gain more prominence.
Labels:
There have been several changes to labels, with different types of labels getting dramatically different symbology. In the past, most every label was black. Now, there are several variations:
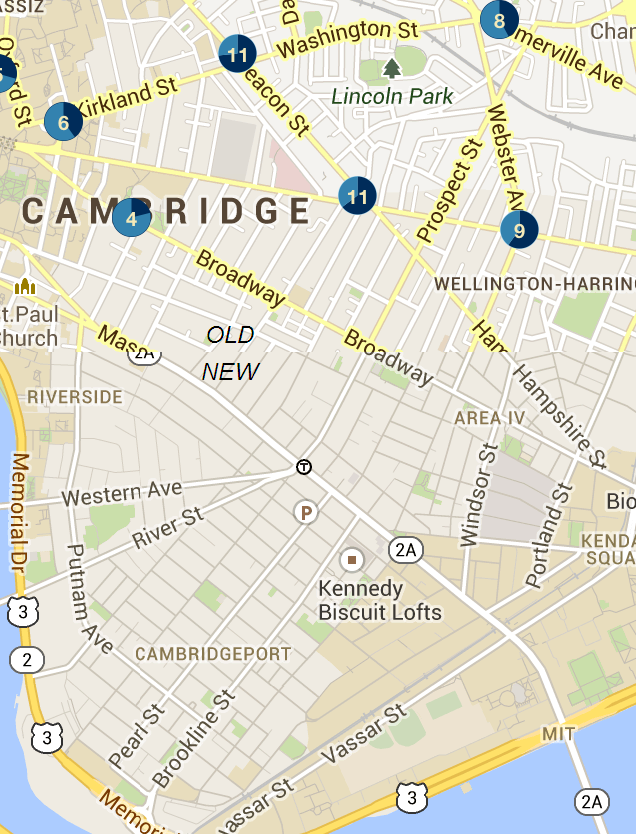
- City, town and neighborhood names are now much lighter brown, and retain all-caps when zoomed. They blend in to the background a bit due to the color, but stand out due to the capitalization and seem a bit bolder.. There does seem to be some confusion; at least in the iOS interface some town names are still black when zoomed out.
- Road labels now echo the road type, although they have quite dark. So orange roads have dark orange labels, for instance.
- Transit station names are now a dark blue color.
- Point features are still black, lakes are still blue and parks are still green.
Area Feature Colors:
Most of the colors of features have been changed, and they are now generally more saturated colors than before. Most noticeable is the change in lakes. In the old interface, lakes were a uniform color of blue, and a rather dull blue at that. The new symbology in the browser version not on creates a more vibrant blue, but it is darker at the outside and lighter towards the center, creating almost a glowing feeling. It works well.
The colors for other features have changed as well. Most noticeably, the difference between parks and golf courses (at higher zoom levels) has been increased, with a lighter, more vibrant green for park areas.
In addition, when zoomed out, there is increased hill shading in mountainous areas; this disappears when you zoom in.
 |
| Browser version(pardon the traffic on the old section; this comes from a post originally over at Unconventional Data. Most of my screenshots have traffic, anyway.) |
Point Features:
One of the other major changes have been to point features. Some, such as rail stations, have had their color saturated. And most any feature that didn't previously have a border has had one added. Since the background of the map is gray, not white, and the background of these circles is white, the point features stand out much more. The symbols have been somewhat simplified, which is generally good, although the park symbol—a tree—is somewhat anachronistic when used for an urban plaza. There are more categories, as well, particularly for features like restaurants and ATMs.
One issue is that these point features also show up on the satellite imagery, where the white background makes their appearance somewhat jarring.
 |
| Browser version |
Transit:
Clicking on "transit" will, in many cities, show fixed-guideway transit lines. In San Francisco, it shows all bus lines. Very cool, although coverage is limited and sporadic (i.e., there's commuter rail in San Francisco and Chicago but not New York or Boston). GTFS transit directions still work. If you try to overlay transit over bicycling, the transit overtakes the cycling interface. So it's not quite multimodal.
 |
| Browser version New York City (Subway only), Chicago (L and Metra), San Francisco (all modes) |
Easter Eggs:
While building outlines and parcel lines haven't been dramatically changed, some Google offices show interior detail. I guess we all get a quick peek in to that special world!
Here's Google HQ:

 Here's the New York office, and Boston. Not far away from the Mountain View HQ is the Bonnie Kitty Fake Company. Here it is on Google Plus. I wonder if this is an easter egg, or if someone forgot to delete a test. Sadly, the number they have listed for it does not go through. Here's a screenshot of the page for Bonnie Kitty, in case it disappears. Notice a familiar color scheme?
Welcome to Google.
Wednesday, July 3, 2013
The wrong way and wrong time to do a bike count
At some point, I might get off my high horse regarding bicycle counts on the Longfellow Bridge. But for now, I'm staying on. Why? Because I did my bike count on a Wednesday morning in June, to get a "typical" commute count (although, to be fair, with colleges out for summer it may have been a bit less traffic than some of the year). And I think I'm collecting better data than the established counts. Going through this process, I've found out more information about the National Bicycle and Pedestrian Documentation project, which is used as a basis for counting by local transportation agencies across the country, including the CTPS locally.
And I have not been particularly pleased with what I've found.
I think I originally buried the lede here, so I'll add a bit here that I reiterate in the final paragraph: the bicycle and pedestrian count methodology treats bicyclists and pedestrians more as leisure users rather than treating them as using viable modes of transportation. We don't take typical auto counts during vacation periods, and we shouldn't do this for bicyclists, either. We should count bicyclists and pedestrians during normal use times, and design facilities based on this usage, especially in urban areas where bicycling and walking are important not only as transportation modes but as congestion mitigation resources
So what's wrong with the national bike counting standards? First of all, the survey methods seem to come from about 15 years ago. From the directions:
Is there an up-front cost? Yes. Although my only overhead was the power to charge my computer's battery and about 30 minutes on Google to figure out how to set up the Excel spreadsheet.
Second, why on earth would you survey typical use on July 4 weekend? I can not get over this. Their explanation is that it is selected because "The 4th of July period … will afford both a typical summer weekday and what is typically the busiest holiday period and activity period for recreational facilities and activities." Three points. First, July 4 is not a typical holiday. You are likely to wind up counting a lot of people walking or bicycling to parades and fireworks. Are there a lot of parades on Columbus Day? So with one of the four annual counts, you're collecting data which is unusable every other day of the year. Second, and excuse the italics, but in what universe is July 5, the Friday after July 4, is going to be a typical weekday? Half of my office is taking it off. Half of the country has vacation bounce messages on their emails this week. Third, while it is a busy time, so many people are traveling that it is not representative of many other weekends. I would contend that you'd get much more useful data by surveying a typical weekend in July rather than focusing on July 4. We're spending all of this time and money to sample bicycle use, and we're collecting just bad data.
Third, while uniformity is sometimes good, bicycle and pedestrian use is highly localized, so what works in one city may not work in another. In other words, there's not a very good argument for standardizing bicycle count dates across the country other than to increase awareness. Awareness is a good thing. But it shouldn't trump good data.
Harrumph.
You'd think that the NBPDP would at least be consistent in their data collection documentation, but this is not the case at all. This current survey is planned for a Thursday, Friday and Saturday. Their instructions document (available here) states that "Weekday counts should always be done Tuesday through Thursday, and never on a holiday." Now, I understand that this is in relation to the national count in September, but, uh, guys? July 4-6 is a Holiday, Friday and Saturday. You're 1-for-3. That might work in baseball, but it's not a passing grade elsewhere.
Finally, in Boston this is an especially fraught issue. Why? Because on July 4, many of the city's highest-use bicycle facilities are being closed. The Esplanade will be closed to bicyclists all day. The Longfellow and Harvard bridges are closing at 4 p.m. So any bicyclists after that point wishing to travel from Cambridge to Boston will have to either cycle across the Charles River Dam, or go up to the BU Bridge. Does it make any sense to take bicycle counts on this day?
I'm not saying that my methodology was perfect, but it's hard to comprehend how the current counts make much sense. If we go around collecting shoddy data and wind up undercounting bicyclists, we have only ourselves to blame when we get underdesigned facilities. It seems like high time to assess both the overall efficacy of the NBPDP, and especially whether Boston should participate in the program.
And a larger, and perhaps more important point: by prioritizing non-commuting periods, we are treating bicyclists as recreational users, not as a viable mode of transportation. Would we count cars during July 4 week? Of course not. AASHTO even says that such periods are "atypical" and would not have valid data. By counting traffic at these times, we are doing a severe disservice to bicycle advocacy.
And I have not been particularly pleased with what I've found.
I think I originally buried the lede here, so I'll add a bit here that I reiterate in the final paragraph: the bicycle and pedestrian count methodology treats bicyclists and pedestrians more as leisure users rather than treating them as using viable modes of transportation. We don't take typical auto counts during vacation periods, and we shouldn't do this for bicyclists, either. We should count bicyclists and pedestrians during normal use times, and design facilities based on this usage, especially in urban areas where bicycling and walking are important not only as transportation modes but as congestion mitigation resources
So what's wrong with the national bike counting standards? First of all, the survey methods seem to come from about 15 years ago. From the directions:
Each counter should bring counting sheets, two writing utensils, a watch or cell phone for keeping time, and a clipboard or other device to write on. Counts are conducted in 15-minute intervals, and comprise the total volume of pedestrians and bicyclists traveling in both directions passing a given point.Here we are, in 2013, when everyone has an iPad and an iPhone and a laptop, and we're taking counts with paper and pencil, and then admonishing people to make sure they don't lose the paper because it is irreplaceable until it has been entered in to the database. Great. When I went to do my count, I didn't even consider using paper and pencil, because it just didn't make sense. I thought about writing a python script, but settled on Excel because it was easier to write and easier to test. But for a national program, how hard would it be to have an iPad app? Nothing fancy, just something where you tap a button every time you see a pedestrian or cyclist (it would be easy to have these buttons be customizable) and then directly upload the time-stamped data.
Is there an up-front cost? Yes. Although my only overhead was the power to charge my computer's battery and about 30 minutes on Google to figure out how to set up the Excel spreadsheet.
Second, why on earth would you survey typical use on July 4 weekend? I can not get over this. Their explanation is that it is selected because "The 4th of July period … will afford both a typical summer weekday and what is typically the busiest holiday period and activity period for recreational facilities and activities." Three points. First, July 4 is not a typical holiday. You are likely to wind up counting a lot of people walking or bicycling to parades and fireworks. Are there a lot of parades on Columbus Day? So with one of the four annual counts, you're collecting data which is unusable every other day of the year. Second, and excuse the italics, but in what universe is July 5, the Friday after July 4, is going to be a typical weekday? Half of my office is taking it off. Half of the country has vacation bounce messages on their emails this week. Third, while it is a busy time, so many people are traveling that it is not representative of many other weekends. I would contend that you'd get much more useful data by surveying a typical weekend in July rather than focusing on July 4. We're spending all of this time and money to sample bicycle use, and we're collecting just bad data.
Third, while uniformity is sometimes good, bicycle and pedestrian use is highly localized, so what works in one city may not work in another. In other words, there's not a very good argument for standardizing bicycle count dates across the country other than to increase awareness. Awareness is a good thing. But it shouldn't trump good data.
Harrumph.
You'd think that the NBPDP would at least be consistent in their data collection documentation, but this is not the case at all. This current survey is planned for a Thursday, Friday and Saturday. Their instructions document (available here) states that "Weekday counts should always be done Tuesday through Thursday, and never on a holiday." Now, I understand that this is in relation to the national count in September, but, uh, guys? July 4-6 is a Holiday, Friday and Saturday. You're 1-for-3. That might work in baseball, but it's not a passing grade elsewhere.
Finally, in Boston this is an especially fraught issue. Why? Because on July 4, many of the city's highest-use bicycle facilities are being closed. The Esplanade will be closed to bicyclists all day. The Longfellow and Harvard bridges are closing at 4 p.m. So any bicyclists after that point wishing to travel from Cambridge to Boston will have to either cycle across the Charles River Dam, or go up to the BU Bridge. Does it make any sense to take bicycle counts on this day?
I'm not saying that my methodology was perfect, but it's hard to comprehend how the current counts make much sense. If we go around collecting shoddy data and wind up undercounting bicyclists, we have only ourselves to blame when we get underdesigned facilities. It seems like high time to assess both the overall efficacy of the NBPDP, and especially whether Boston should participate in the program.
And a larger, and perhaps more important point: by prioritizing non-commuting periods, we are treating bicyclists as recreational users, not as a viable mode of transportation. Would we count cars during July 4 week? Of course not. AASHTO even says that such periods are "atypical" and would not have valid data. By counting traffic at these times, we are doing a severe disservice to bicycle advocacy.
Subscribe to:
Posts (Atom)