Wednesday, January 23, 2013

When the T steps in it, what happens on Twitter

Not 10 minutes after I got in to the office today, word came out that there was a power problem on the Green Line, and the Red Line was in rough shape. This is a fine example that 44-year-old trains in 110-year-old tunnels need some investment. Next thing we knew, there were 30 minute wait for Red Line trains (scheduled headway: 4 minutes) and the Green Line was shut down at the peak of rush hour with inadequate bus replacement.

I was interested in looking at pictures from the junkshow, while sitting in a heated environment. And I realized that the number of Tweets tagged #MBTA was increasing. Starting at 8 a.m., the number of tweets per minute went from 3 per minute screaming up to triple that amount by 9 a.m. The tweets then leveled off and fell back. The Green Line was still shut down (it didn't open until after 11:00) but the Red Line had recovered and the rush hour crunch had dissipated. Not much to comment on here, just a quick look at what happens to Twitter when two thirds of the MBTA's ridership is affected by broken-down trains on a cold, cold morning.


A word on road salt

That's not snow.
(Boylston Street south of Boston Common)
There's been some grief on the Internet and the Twitterverse about the heaps of road salt thrown about the roads in Boston in the last couple of days. What happened—I think—is that several inches of snow were predicted (albeit with a lot of doubt if you actually read the forecast discussion) and the city preemptively salted the roads. No snow fell, the salt got ground up, and high winds wafted it in to the air. It's pretty gross. And it's really bad for your bike.

Yes, Massachusetts oversalts and overplows. A moderate snowstorm on a Sunday morning will see thousands of plows fanned out across the state. I've driven during a storm and seen phalanxes of 10 plows stretched across three lanes, scraping the road clean from side to side, even though there wasn't that much to push off. Cities take a bit longer, but they generally get the roads clean. And they salt the hell out of the roads, apparently. Every guy with a landscaping truck has a state plow contract, and by golly they'll get them roads down to pavement. Even if they already are.

But then there's Minnesota. Unless there is heavy snow, they don't touch the roads. A few inches? It will get blown off after a while. If it's cold, that's the case, and salt won't do much good. But when there's more snow, and it's warmer, it gets compressed and if temperatures then fall it freezes solid. If there is heavy snow, there are not enough plows to go around, and roads don't get cleared as quickly as they should. And in the cities? They plow the day after the storm, and don't even bother to push the snow off of corners, so what they're really doing is plowing powder off the previously compressed snow leaving ridges of ice all winter on every side street. You have to move your car so they can plow to the curb on all streets, but by the time everyone has moved their cars there's compressed snow all over the place. If it's -5 by the time the plows come around, they don't do too much good.

They also don't salt pretty much ever. Sometimes it's too cold, but sometimes a couple inches of snow falls, melts a little, turns to a sheet of ice and then freezes, at which point the streets are skating rinks. There is an issue of lakes becoming saltier—which is less of an issue in Boston where most runoff finds its way in to the already-salty ocean—but judicious use of road salt when it's needed would be nice.

I'm sure there's a happy medium between these approaches. If anything, maybe in Boston we can get them to not salt the roads until it actually snows. And, good golly, the sidewalks.

Monday, January 21, 2013

The Amazing Lack of Density of the Boston Fed

The three tallest buildings in Boston are:

  1. The John Hancock Tower at 790 feet with 60 stories
  2. The Prudential Center at 749 feet with 52 stories
  3. The Boston Fed at 641 feet with 32 stories
Their floor-area ratios (the amount of interior space they have relative to their overall ground footprint) are:
  1. 25.44 (see here)
  2. 5.93*
  3. 4.34 (see here)
* This includes the entire Prudential Center, which has a footprint of over 1 million square feet, or 100,000 square meters. Much of this is retail space; the office portions are much higher. See section 2-8 of this report.

The Pru sort of gets an out. It was built on former rail yards and above a highway, it's had more density added in recent years, and a lot of it is an indoor shopping area and supermarket. In addition, it's better oriented itself to nearby streets in recent years (although it certainly has a ways to go to integrate in to the neighborhood). 

The Fed doesn't. It has a big outdoor plaza and a small, low-rise conference center and … not much else. There's a nice plaza outside (we wrote about it's many bollards) with an adjacent entrance to the subway. (Interesting to note that the three tallest buildings in town are all within a block of a major transit node.) But transit is a great place to build dense buildings. You don't need a lot of parking spaces, as innumerable people can walk through the doors without major congestion. Maybe you won't build the Hancock tower. But a FAR of 4? That's no improvement over the low-rise buildings the site replaced. It's not as bad as a suburban office tower surrounded by parking lots, but for such a tall building, it has a large footprint, and surprisingly little inside space.

Friday, January 18, 2013

The Amazing Bollards of the Boston Fed

Bollards—those vertical posts used to keep cars off of bike trails or separate lanes of traffic—are also used to protect sensitive buildings from vehicular incursions. Many government buildings—and most of the city of Washington, D.C.—are surrounded by steel or concrete posts. In most cases, these are architectural afterthoughts, and in many cases they are ugly as sin. While they seem to crop up everywhere, their use, especially after incidents like the 1995 Oklahoma City bombing, is probably justified in some situations. They are relatively inexpensive, don't impede pedestrian flow, and are quite effective (i.e. not just security theater).

Left: Ugly-as-sin bollards at the Tip O'Neill Building near North Station (probably added after construction). Right: Boring bollards at the newly-built Moakley Courthouse on Fan Pier.
And they don't have to be ugly as sin.

Take, for example, the Boston Federal Reserve bank. Considering it is one of 12 banks in the country charged with distributing the nation's cash supply, you probably don't want people to be able to ram a car in to it. The modernist building is striking—it's by far the tallest Federal Reserve Bank branch in the country and one of the tallest buildings in the city of Boston—so it has quite a bit of symbolic value. For a variety of reasons, you don't want cars driving in willy-nilly. (If you do drive in, you go through a heated inspection building where they inspect your vehicle, including peering underneath with mirrors on sticks.)

Around the time of the Big Dig (check it out on HistoricAerials, or this picture from the installation firm) the plaza around the building was rebuilt, and instead of a bunch of concrete or aluminum-and-steel bollards, the landscape architects got creative. There are no fewer than 15 distinct types of bollard (!)—or other fencing with a similar function—combining different materials and serving multiple purposes. Many of these are cleverly camouflaged in to the landscape. You still get the idea that they don't want you trying to ram through the doors in a car, but it's not as ugly or overbearing as most such security.

I noticed this (yet again) coming back from a talk by Julie Campoli, who has cataloged housing types and walkability beautifully in presentations and 
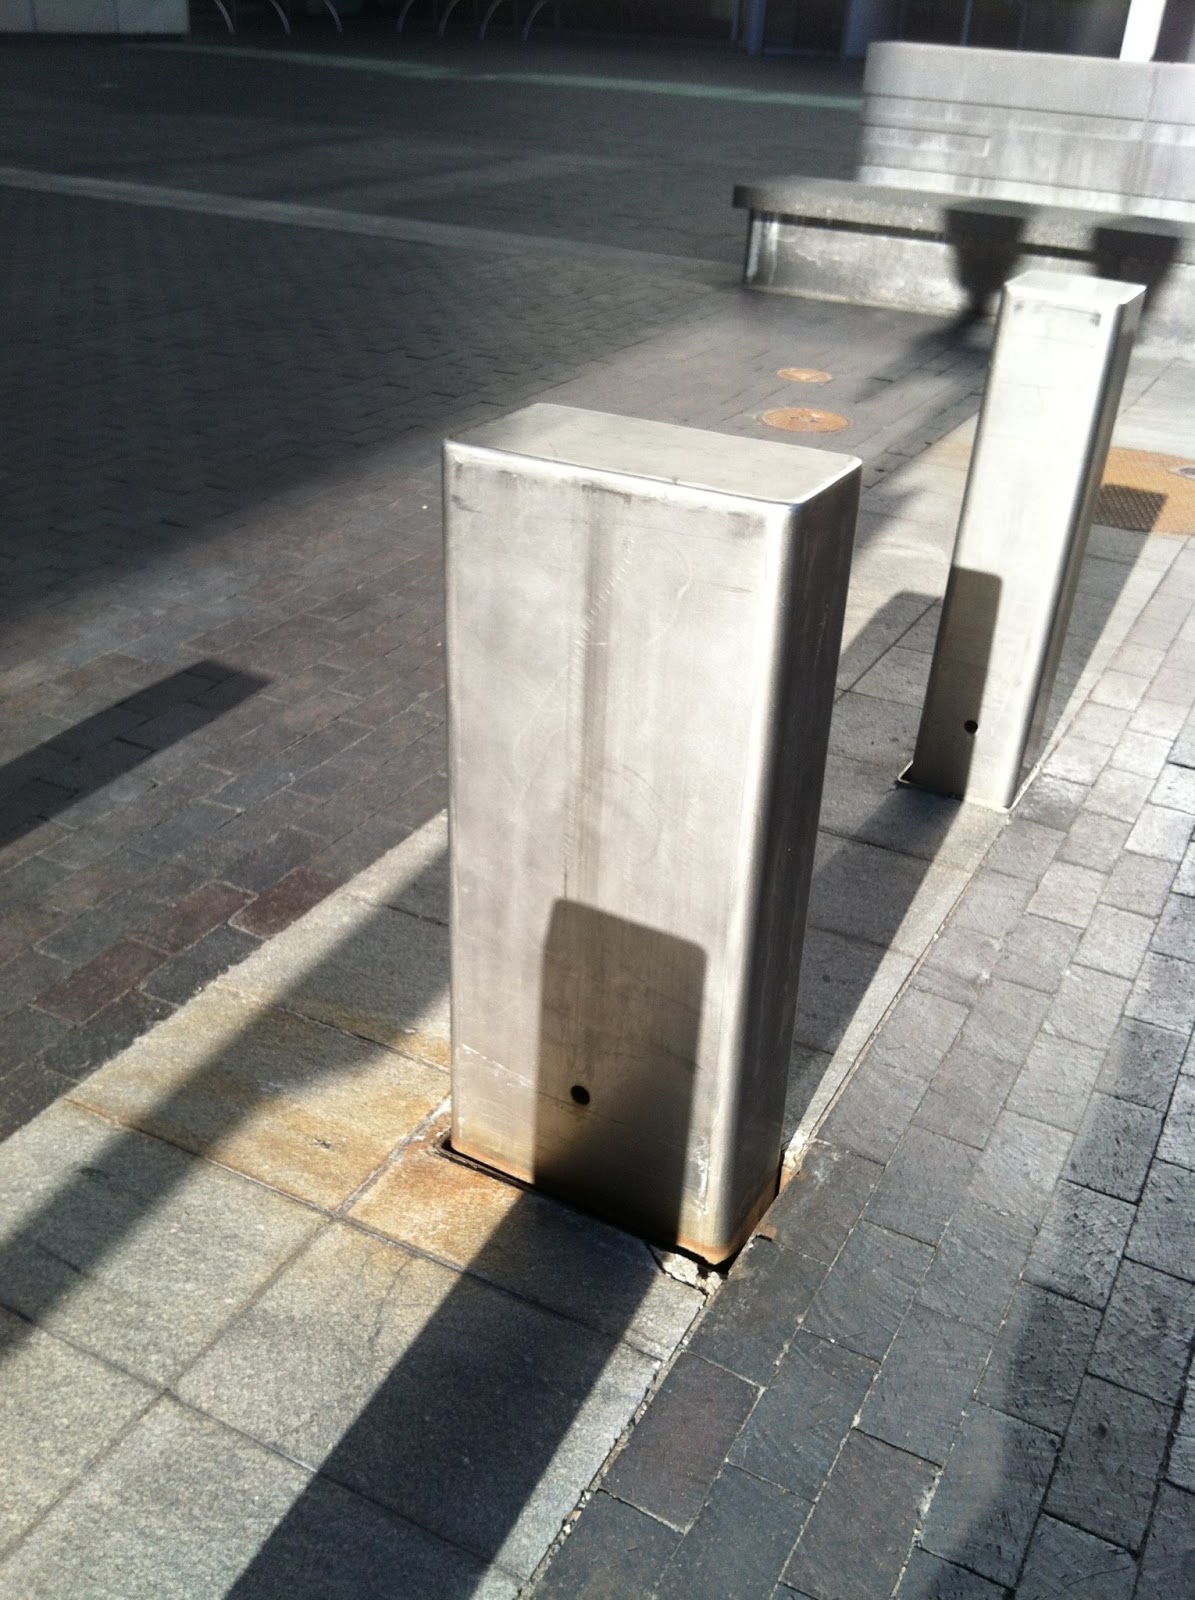
books, and decided to do something similar with the Fed bollards. Here is a compendium, with descriptive names I made up.

Left: Steel-and-bench
Center: Single-indent concrete
Right: Double-indent concrete

Left: Slate-with-bench
Center: Wide steel
Right: Marble and stacked-slate

Left: Upside-down boat keel
Center: Square steel
Right: Big round planter

Left: Trapezoidal-ish steel
Center: Boat keel with bench
Right: Torpedo/candlepin bowling pins

Left: Beveled concrete with square holes
Center: Corners with benches
Right: Beveled concrete with extending benches

There would be a larger project here to walk (or bike) around the city and find all the different examples of anti-vehicle security. Maybe when it's above 20 degrees.

Walking around the Fed, you get the idea that someone put some thought in to the landscape. It is a large and looming building (it's tall and attractive, but it looms) but the plaza is built to a human scale without being monotonous and without losing its security purpose. There are a multitude of materials (granite, slate, concrete, aluminum, steel, brick, grass), shapes and sizes. Much of the plaza is functional. Benches provide a place to stop and sit. Trees provide shade. And it's unobtrusive (unlike the horrible Tip O'Neill balls o' concrete or the mid-sidewalk steel bollards down Atlantic Avenue at Rowes Wharf). Hopefully new buildings, when they need this type of security, will have some scrutiny as to how it is designed. This is a good example.

Now, there's the argument that this site sacrifices a lot of density by having this big plaza, and despite the height of the building its floor-area ration (FAR) is not that high, only about 4:1! (In other words, if there was a four story building built across the whole site (which is what this building replaced) it would be denser, despite the fact that this is the third tallest building in the city! But at least the security outside is pleasant.

Monday, January 14, 2013

What do you do with $13 billion

The Big News today is that the governor of Massachusetts has finally begun to detail how we are going to fund some sort of barely-functional-at-least transportation system in the Commonwealth. (No specifics on which revenue streams will be pursued, only that some will. Here's to hoping we take the easy and best route.) More specifics are coming soon, but the state offered up a bit of a wish list of major projects these additional revenues could help fund (such as rebuilding the entire MBTA rail fleet and the bus fleet for RTAs across the state).

Now, this is obviously the first step in a game of political football, and certainly won't be whatever is inked later this year (hopefully). Various interests (and even Republicans) will have their say, although business leaders seem to be all for increased funding and drivers may even grudgingly accept higher taxes. That can wait.

For now, I took the "wish list" and broke it down in two ways. First, I looked at each line item and what it funded: Air, Transit, Bike/Ped and Highway. I broke the transit out in to "existing" and "new" as the funding divides between improving existing services (such as replacing 40-year-old rail cars) and new funding for transit services which do not yet exist. This was a rough exercise, and certainly there is overlap (local highway funding will include bike/ped improvements, rail extensions will improve service on inner portions of the line) but it gives a good idea.

The second thing I looked at was whether each item benefited one region or multiple regions. This was even rougher. Some projects are statewide, some fund specific projects in multiple regions, and some are region-specific. The categories here were "Multiple Regions" (which includes statewide projects), "Non-Boston Area" (RTAs, mostly), "Boston Area", and the West and Southeast parts of the state. There were no projects which specifically served the central or northeast regions, although they would be served in the statewide categories.


My quick takeaways:

  • More transit than highway, by an almost 2-to-1 margin.
  • No new highway construction—just rebuilding bottlenecked intersections. As far as I can tell, not even any highway widenings.
  • Bike/ped is a small percentage, but the raw number—$430 million—is quite big. Hopefully the $1 billion slated for local roadway improvements is mandated to create complete streets as well.
  • Most of the funding goes to the Boston area or the state as a whole; the big chunk for the Southeast is for the South Coast Rail project (and, yes, we can discuss whether that is a good use of funds later).
  • This is a pretty good start. Hopefully the highway lobby won't throw up their hands and demand more roads, especially since bicycle and pedestrian projects create more jobs than highway projects.
  • This is a good start—but, yes, a start—towards tripling non-auto mode share in the Commonwealth (also see the linked article for Davey's read-my-lips-no-new-superhighwas quote).

Tuesday, January 8, 2013

Cool map of the day

This past summer, I took a post from Alon Levy and charted out the ridership for New York's commuter lines, and then built on that to chart the average speeds from various stations for the MBTA. (10 points if you've followed along so far.)

The next logical step, of course, was to map these. And someone has. Peter Dunn has mapped both the MBTA transit services and the commuter rail based on time. (His other maps are equally cool, I particularly like the ones of state highway shields and the Appalachian Trail.) The transit map (here's the full scale version) is particularly useful in figuring out, visually, how far it is between different stations. Good stuff!

A minor quibble: he used Google trip finder to get the times between stations, although this time varies by time of day. For the Commuter Rail, thanks to express trains, there are several instances where the trip time from the last station before an express run (Natick, South Acton and Salem are examples) is actually faster than the next-closest station that doesn't have express runs. This is a bit harder to show in these maps.

For transit, the T's schedule is something of a junk show. What would be interesting is looking at how the transit maps change based on the time of day. The MBTA's Blue Book (large PDF) has the scheduled run times for transit services at different times of day (see chapter 2, pages 13, 20, 24 and 28). There seem to be two factors which impact run time. One is that on lines with multiple branches (the Red and Green lines) there are more delays at junctions when trains are more frequent. The other is that, for all lines, dwell times increase when there are more passengers boarding and alighting the trains.

These differences vary between lines, but one stands out. Here are the longest and shortest run times for each line, with the range of average speeds:
Time Range (min) Speed Range (mph)
Blue 18 - 23 15.5 - 19.8
Green (B) 33 - 53 7.4 - 12
Green (C) 23 - 42 8.3 - 15.1
Green (D) 34 - 46 16.3 - 21.6
Green (E) 25 - 35 8.8 - 12.3
Orange 32 - 36 18.5 - 20.1
Red (Ashmont) 35 - 42 16.7 - 20
Red (Braintree) 46 - 55 19.2 - 23
Notice anything? The slowest speeds are, of course, on the Green Line, although the grade-separated D Line attains speeds which match the other heavy rail lines (even while it has to traverse the painfully slow Central Subway). But even the Green Line has much more variability than it's heavy rail counterparts. Why? Assuredly, a lot of it has to do with the lack of all-door boarding and on-board fare collection.

It would be interesting to compare two of Dunn's maps, one showing the best case scenario for each line, and one (perhaps when moused-over) showing the worst case. In any case, good stuff.


Wednesday, January 2, 2013

Mass. gas taxes lower than region, nation; parity would go a long way

I drove out to Syracuse over the holidays. When I filled up with gas in Massachusetts, the going rate ranged from $3.30 to $3.45, at least outside of downtown (where the cost of land and logistics raise the price somewhat). In Syracuse, however, most stations were in the $3.60 range, and I held my nose (although not too hard; I had borrowed a Prius for the trip so even a full tank ran under $30) and filled up.

And I got to thinking: why is gas in Massachusetts so much cheaper? I know why it's cheaper than New York City, where gas stations take up precious land and you can't build above them (because how scary would it be to live in a building sitting atop a bomb)? But upstate? Does delivery cost more? Are there some extra regulations in New York and not Massachusetts? Is the gas tax higher?

Oh, right, the gas tax is higher.

Massachusetts has a middling gas tax of 23.5¢ per gallon, 24th lowest in the country (and it hasn't gone up in more than 20 years). New York's tax is the highest in the US, more than doubling Massachusetts at 51.3¢. (Here's Wikipedia on gas taxes by state including the federal 18.4¢ tax). New York's economy seems to get along fine, and the gas taxes assuredly help New Yorkers fund their transportation network.

But Massachusetts lags even the national average of 27.5¢ per gallon. Gas prices are relatively well-correlated to state population (but, surprisingly, not by population density; see charts at the end of this post), so small, low-tax states skew this mean. Weighing the average by population shows that the average American pays a gas tax of 32.1¢ per gallon.

What about the region? How does Massachusetts compare against its neighbors, if not the whole country?

New York 
51.3¢
Maine
31.5¢
Connecticut
45¢
Vermont
26.5¢
Rhode Island
33¢
New Hampshire
19.6¢
Except for Live Free or Die New Hampshire, Massachusetts' neighboring states pay higher gas taxes. Even in rural Maine and Vermont, where there are few transit options, gas taxes are higher. New York and Connecticut have dramatically higher taxes (putting thems in the top-10 highest gas tax states). Massachusetts seems like an anomaly here with lower gas taxes despite higher-priced neighbors and a transportation system which desperately needs the money.

The average in the region? 34.5¢. The weighted average? 46.7¢ (New York accounts for 71% of the population; Connecticut another 13%.)

Now, what would an increase gas tax would raise in Massachusetts? Last year, the MAPC put out a great MBTA budget calculator to try to close the gap in T funding. By their estimates, every 1¢ rise in the gas tax nets $27.7 million per year. Since even a 25¢ rise only accounts for a 7% rise in the overall gas price, we can assume that the gas tax wouldn't decrease demand for fuel dramatically (demand for gasoline is quite inelastic). So here are some scenarios:
  • Match the national average of 27.5¢. Annual revenues: $110 million.
  • Match the national weighted average of 32.1¢. Annual revenues: $238 million.
  • Match the regional average of 34.5¢. Annual revenues of $305 million
  • Match the regional weighted average of 46.7¢. Annual revenues of $656 million
  • Match New York's gas tax of 51.3¢. Annual revenues of $770 million
What if we raised the gas tax by 15¢ per gallon over three years—a nickel per year—and then did something really smart and indexed it to inflation? First of all, we'd still a ways from the top of the list of states by gas taxes. Three years out, we'd have somewhere along the lines of $400 million in additional gas tax revenue per year. I see this splitting in to five pots:
  1. MBTA operating subsidies. This could be 5¢ per gallon, although such a static cap could lead to issues if tax revenue lags like sales tax revenue did in the current budget predicament. Still, if there isn't a huge debt transfer to the T (like there was in 2000) it would be less of a concern. (This 5¢ could also go towards Big Dig debt repayment, or that could come out of other portions of the tax.)
  2. RTA operating subsidies. 1¢ per gallon. Massachusetts regional transit authorities provide transit service to many cities and towns outside of the Boston area, and dedicated funding could allow them to improve and add service, as many operate limited schedules on only some days of the week. (The RTAs have less than 1/10th the ridership of the MBTA, so this is a higher per-rider subsidy and would help bring the votes of legislators from further afield.)
  3. Transit infrastructure improvements and projects. 4¢ per gallon. This money could probably be used to leverage private, local and federal funding.
  4. Highway infrastructure improvements and projects. 4¢ per gallon. This money would also probably help to leverage matching federal dollars.
  5. Bicycling and pedestrian improvements. 1¢ per gallon. It's a small chunk of the puzzle, but $25 million per year would go a long way.
State policymakers in Massachusetts seem to realize that something has to be done about transportation funding. In the midst of the recession, business leaders called for a 25¢ gas tax hike. In 2009. 25¢ would give another $300 million per year for things like infrastructure improvements and debt payments (although it would still fall short of some estimates of the need for infrastructure improvements). This is the kind of sensible changes that we will need in order to have a functional transportation system. And if we look to our neighbors, we can see that, despite concern trolling (this article has a sad story about a guy filling up his wife's Lincoln Navigator who might get hit for $500 a year—but apparently can afford to own and drive a 16 mpg Navigator) that always bubbles up when the gas tax is mentioned, raising the tax enough to begin to pay for our transportation system is certainly feasible.

As mentioned above, here's a chart of gas taxes by population and density:


A quick note on Vehicle Miles Traveled taxing, or VMT: it may be a more palatable alternative to gas taxes, but it's bad policy. First of all, it would require significant infrastructure to require people to have their odometers read, probably at a state inspection. It would also incentivize people to register their cars out of state, which is not a particularly difficult thing to do, especially for a state with a lot of migration in and out. Finally, a VMT tax disincentivizes driving, while a gas tax pulls double duty and discourages driving and the purchase of larger, less efficient vehicles. In other words, there is no logical argument for a VMT over a gas tax.

Big Car Sharing News

You may remember that I am interested in car sharing. You may also remember that I stated that I didn't think car sharing was a good investment. You are going to hear a lot about Zipcar being bought by Avis today. This may be a mutually beneficial agreement: Avis gets in to the hot car-sharing market, and gets to leverage its much larger business for Zipcar's benefit. (I'm assuming it will be run as a separate brand; they stand to lose a lot of cache, especially in competitive markets, if they drop the successful Zipcar marketing.)

But as for the investment piece: yes, investors are getting a 50% premium on the current stock price (ZIP), and almost double the recent lows it hit this year. It's also 2/3 the price of the IPO a year ago, and less than half of the post-IPO heights Zipcar realized in 2011. So anyone who got excited about Zipcar and bought stock at the IPO price or above is going to take a haircut. And Avis Budget (CAR) doesn't appear to be a major growth property.

This sale doesn't mean that car sharing is mature, but that it is growing. Independent CSOs will continue to have a foothold  in several cities, competing with Zipcar and keeping prices down in those markets (see, in particular, Chicago and San Francisco in the US, Toronto and Vancouver in Canada; and then there's Montreal where Communauto is such a force that Zipcar has steered clear). It will be interesting to watch this market continue to evolve.